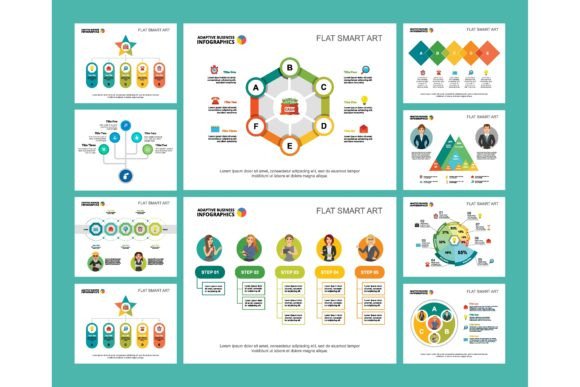
Colorful Analytics: The Psychology of Data Visualization
Behind every chart, graph, and dashboard is a human eye and a human brain waiting to be engaged. Colorful analytics isn’t just about making reports look pretty. It’s a management and communication concept rooted in the strategic use of color to transform raw data into clear, actionable, and memorable insights. By applying principles from psychology and design, this approach turns numbers into narratives that different audiences can instantly understand.
Why Color Communicates More Than Numbers
Think about the last report you skimmed. Was it a wall of gray text and monochrome bar charts? Our brains process color faster than text or shape. A well-chosen palette can highlight a critical trend, group related categories, signal performance (red for danger, green for growth), and guide the viewer's attention. This isn’t mere decoration; it's a functional layer that reduces cognitive load. For a manager, a sudden shift from blue to orange in a timeline might immediately flag a problem period without needing to read every figure. For a beginner, colors can serve as a friendly guide through complex information.
Different Audiences, Different Color Priorities
The value of colorful analytics changes dramatically depending on who is looking at the data and why. A single infographic set must serve multiple purposes, and understanding these differences is key to using color effectively.
For Professionals and Corporate Leaders: Decision Speed & Reliability
In a boardroom or executive summary, time is the scarcest resource. Here, color is a tool for speed and precision. Professionals prioritize a consistent, reliable color system—a "branded" analytics palette. Sales might always be blue, marketing green, and operational costs amber. This creates instant recognition across all reports, saving time and reducing confusion. The focus is on clarity and commercial value. A colorful management dashboard for a retail chain might use a stark red overlay on a map to pinpoint underperforming regions, directing strategic investment within seconds.
For Creators, Educators, and Presenters: Engagement & Storytelling
For an educator explaining economic trends or a marketer presenting campaign results, color is the hook. Their priority is engagement and learning value. They might use vibrant, contrasting colors to create visual "chapters" in a presentation slide. An educator could use a gradient from cool to warm colors on a chart to visually explain the concept of increasing temperature over time, making the data intuitively understandable. Flexibility is key here; the same data set might be colored differently for a conference poster versus a detailed academic handout.
For Entrepreneurs and Small Business Owners: Simplicity & Action
Small business owners often wear all hats and need insights that translate directly into action without requiring a data science degree. For them, ease of use and practicality are paramount. A colorful analytics concept applied to a simple monthly profit-and-loss infographic can use green for revenue streams and orange for expenses, making the financial health of the business visually obvious at a glance. It demystifies data, turning it into a regular, manageable check-up rather than a daunting chore.
For Beginners and Hobbyists: Learning & Confidence
A newcomer to data analysis, perhaps a hobbyist tracking personal fitness or a blogger monitoring website traffic, needs approachability. Color serves as a gentle guide. A pre-designed, thoughtful infographic chart set can help them identify patterns they might otherwise miss. Their priority is learning value and long-term usefulness. Seeing their own blog’s visitor sources color-coded (social media in purple, search in teal) makes the abstract concrete, building confidence to delve deeper into analytics.
Evaluating Your Needs Against the Colorful Approach
How do you know if investing time in colorful analytics is right for your project? Ask a few simple questions about your goals and your audience.
Is communication your primary aim? If you need stakeholders, clients, or a public audience to quickly grasp your findings, color is a powerful ally. A monochrome report might be accurate, but a strategically colored one is understood and remembered.
Is your data complex or multi-layered? Color can disentangle intertwined metrics. For instance, a layered chart showing both customer satisfaction (using a sentiment color scale) and response times (using a speed gradient) can convey two stories in one visual space.
Are you creating materials for repeated use or training? Building a consistent colorful scheme into your regular report templates or instructional materials saves future effort and creates a familiar, trustworthy resource for your team or students.
Practical Examples Across Use Cases
- Corporate Report: A financial annual report uses a restrained, professional palette. Shareholder return trends are shown in a trusted deep blue, while risk factors are highlighted in a distinct, non-alarming saffron, allowing for clear distinction without causing undue panic.
- Advertising Leaflet: A leaflet for a new analytics software uses bold, energetic colors in its infographics to showcase the software's benefits—a bright chart comparing "time spent before" (grays) and "time spent with our tool" ( vibrant blues and greens) instantly communicates efficiency.
- Presentation Slide Templates: A slide deck for a project proposal uses a sequential color scheme. Phase 1 is in cool tones, Phase 2 shifts to warmer neutrals, and the final launch phase is in a bold, celebratory gold. This visually tracks the project journey.
- Poster Design: An educational poster on climate change uses a stark, emotional color progression. Historical data is in stable greens and blues, recent decades shift to yellows and oranges, and projected future models are in urgent reds, creating a powerful visual narrative that resonates emotionally.
The Balance Between Creativity and Convention
While color offers immense creative freedom, effective colorful management also respects convention. Red almost universally attracts attention and can signal a decline or alert. Greens and blues are often associated with positive growth and stability. Using these conventions helps ensure your message is decoded correctly. The creative twist comes in how you combine these colors, assign them to your unique data categories, and build a harmonious system that is both informative and visually coherent for your specific context.
Ultimately, adopting a colorful analytics concept means recognizing that data has an audience. Whether that audience is a busy CEO, a room of students, your own team, or yourself, color is the bridge between raw information and human understanding. It’s a tool that scales from a simple hobbyist's spreadsheet to a multinational corporation's annual review, making the complex clear and the mundane memorable.